Understanding the Terms
Accelerated and automated underwriting are often used interchangeably in published articles and among senior executives. Both imply fast, so logically it makes sense to think they are the same thing. However, accelerated underwriting and automated underwriting have different meanings.
Automation/Automated Underwriting: In the simplest terms, automated means no human underwriter involvement needed. Automated underwriting essentially automates what a human underwriter has traditionally done. For example, Velogica® is SCOR’s automated underwriting engine which has the ability to render an underwriting decision in less than a minute without the use of an underwriter.
Accelerated Underwriting (AUW) may or may not include automation. “Accelerated” means that a certain percentage of lower risk applicants are “accelerated” through the underwriting process without some of the traditional requirements, such as fluids (blood, urine, vitals). These applicants typically do not have any significant medical conditions that would prompt the need for additional requirements.
With AUW programs, a comprehensive application is used, and preferred classes are commonly available. The price is very close to, if not the same as, a fully underwritten product. Additional data sources are often used to help offset the protective value of fluids. One of the challenges of AUW is determining how best to funnel applications to the fluidless or traditional path.
Simplified Issue (SI) is sometimes confused with accelerated underwriting since neither involve the collection of fluids. However traditional SI and AUW are actually very different. SI typically has a limited number of application questions with a mortality load built into the product and preferred classes are not available. The resulting price is much higher than traditional full underwriting.
Predictive Models
So where do predictive models come in? Predictive models are often used in conjunction with accelerated underwriting programs, but they can exist anywhere. There are various types of predictive models being deployed in the market today. Mortality, underwriting class and/or the probability of smoking are the most common targets being modeled currently. Some carriers have built their own predictive models to either predict underwriting class (without fluids) or actual mortality. Credible predictive models require a significant amount of data. Often life insurance carriers have to look for third parties in search of such data.
Credit scores are being used by many carriers. These scores provide a numerical value associated with the degree of relative mortality risk. However, since the inputs in the model differ from what the industry has used historically in underwriting, the score may not align with how the underwriter assessed the risk. This disconnect often creates confusion. This does not mean that either the underwriter or model is wrong though! Both approaches simply aggregate applicants into different ‘buckets’. The credit-based mortality models aggregate people with favorable credit/financial factors, while the underwriter aggregates people with favorable personal history and biometric parameters.
Since underwriters are naturally very analytical, it is completely natural to question how a model can possibly be better than a human underwriter at assessing risk. Before you shake your head in disbelief, it’s important to understand how underwriting guidelines and preferred criteria were initially developed. Since the start of preferred class insurance underwriting, clinical medical research such as Framingham and the Build and BP study of 1979 have been used to develop underwriting guidelines and criteria. Preferred underwriting criteria such as build, BP and cholesterol levels were determined to be usable factors based on these studies.
Driven in significant part by mortality research by Exam One and Clinical Reference Lab the environment changed around 2012. These companies used their large data pools and combined them with mortality feedback through the Social Security Death Masterfile (SSDMF). Lab scoring such as Risk IQ and Smart Score were born. The results were shocking to many underwriters—the criteria underwriters had been using for years were not the strongest mortality predictors. Many applicants who received preferred rates actually had risk profiles more indicative of standard or even substandard mortality expectations.
In addition to not using the strongest mortality predictors, most companies do not have different thresholds based on age and/or gender. These factors coupled with the use of traditional knock out methodologies created a risk classification system that was less effective than desired.
Figure 1: Varying the Thresholds by Age and Gender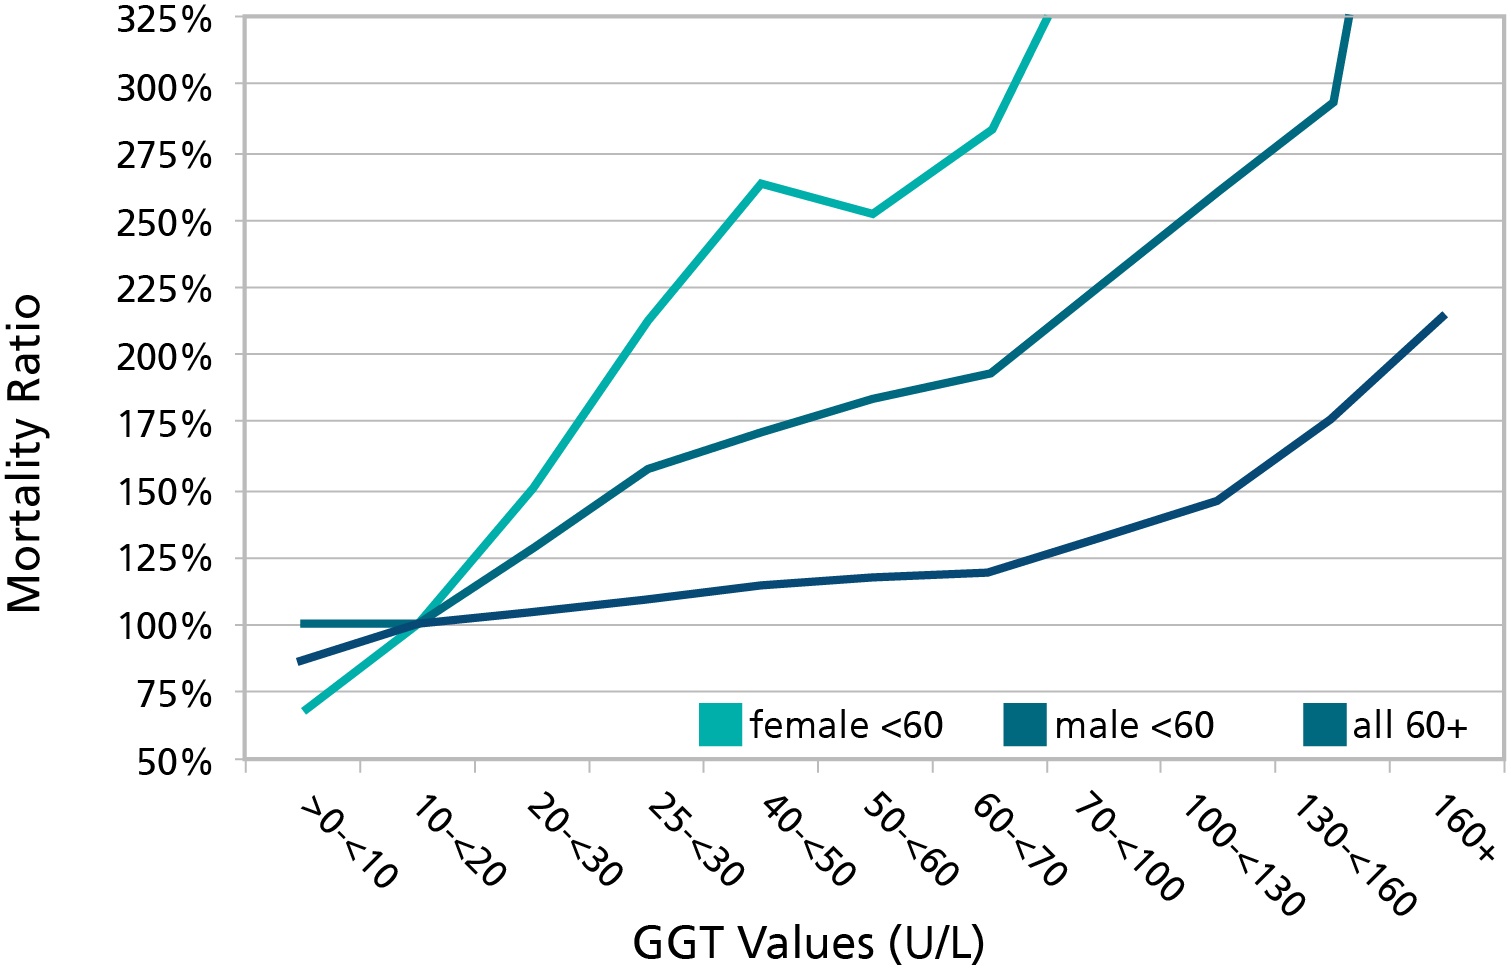
GGT = Gammo-Glutamyl Transpeptidase, a screen test for liver damage. This graph illustrates how thresholds vary by age and gender. For those under age 60, the mortality starts increasing around the age of 20. However, underwriting manuals typically ignore thresholds less than 100-130, even allowing the best preferred class. This flaw exists with virtually every variable used in underwriting.
Source: J Insur Med 2008; 40; 191-203
As a result, there has been significant overlap of individual mortality within traditional preferred classes. However, there is one benefit – because the system is inefficient, it is at the same time highly resistant to the effect of small changes in criteria (frequently prompted more by competition than data analysis). While not designed that way, it has actually "protected" the industry to some degree from the many capricious changes to criteria over time.
Figure 2: Historical Distribution of Risk Scores for 35-year-old Non-smoking Males
Predictive models attempt to correct inefficiencies that exist today. Armed with new statistical techniques, companies with significant data can now create a better mortality model that incorporates a risk ranking system for age/gender cohorts based on actual mortality. New correlations can be discovered that are grounded in data specific to the insurance buying population and not primarily on medical research on general population studies.
A Predictive Model Example
Consider the predictive model created by one of the US’s largest direct writers. The model uses all underwriting inputs to arrive at an underwriting decision -- not just labs or credit-based attributes seen in other predictive models. The proprietary mortality risk scoring engine was trained on a comprehensive, historical data set of application data using advanced statistical and machine learning models of survival. The model estimates an applicant’s mortality risk conditional on 50+ features drawn from fluid lab tests, personal and family health history and ground-truth survival data.
Two primary modelling techniques (Cox Proportional Hazard and Random Survival Forest) were used. Both models score all individuals and then organize them into underwriting classes to maintain the same empirical distributions by age, sex and issue year. The model output is mapped into underwriting classes based on thresholds used during the development of the model to generate survival curves which appear to match or beat the actual curves from traditional underwriting.
Change and complexity is the new norm. While new concepts and terminology may appear overwhelming, embrace it! Data is the new currency and it is time to challenge our old way of thinking. Prepare yourself for changes: Consider taking a course on statistics or modelling. Sit down and talk to a data scientist or statistician to gain insight from their perspective. As the old adage goes, knowledge is power!