The U.S. population mortality has been in the news over the last three years with a consistent message – there’s been a stalling of mortality improvement and a noted increase in opioid-related deaths. While the drivers of population mortality do influence life-insured experience,
there are also very large effects on life-insured mortality due to the policy purchasing process.
A specific subset of the general population will be represented in the insured market, which will vary from company to company depending on their target markets. Not everyone has life insurance for one reason or another and, furthermore, there are effects from the underwriting process which has changed over time as underwriting practices evolve. As a result, life-insured mortality rates have differed greatly from population rates for many decades.
There have been significant declines in life-insured mortality rates in life insurance industry tables over the last 30 years. In Figure 1, male mortality rates at issue ages 40, 70 and 75 at
duration 16 (attained ages 55, 85 and 90) are shown to the right. Please note the SOA 7580 mortality table was not smoker/nonsmoker distinct.
Figure 1 - Mortality Rates at Duration 16
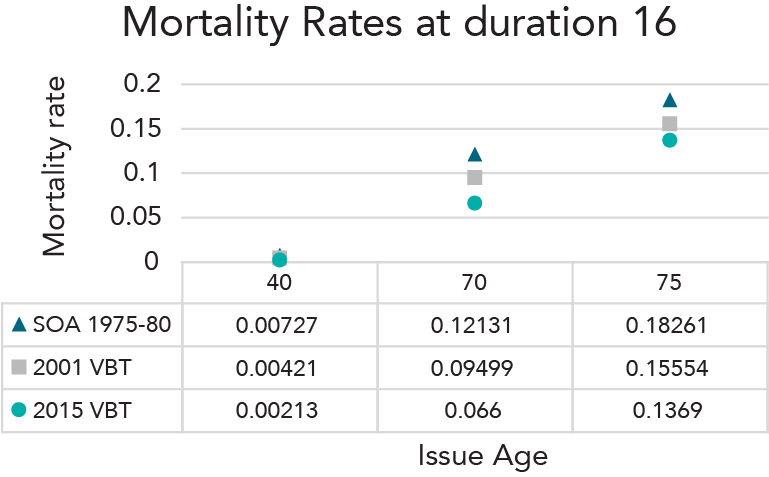
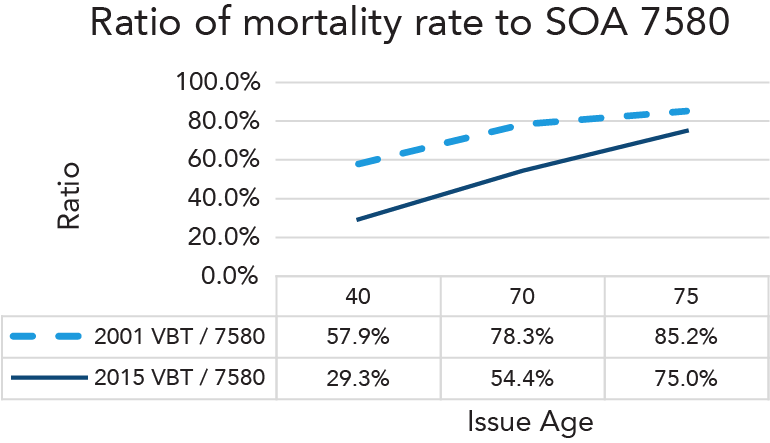
The percentage changes in industry table mortality rates have been very large for the younger ages (2015 VBT rate is 29.3% of the 75-80 rate by attained age 55), more moderate at 85 and
very moderate at 90 (2015 VBT rate is 75.0% of the 75-80 rate by attained age 90). The recognized improvement for males age 90 has only been near 0.5% each year between the release of each table.
The SOA’s 2009-2015 Individual Life Insurance Mortality Experience (ILEC) study focuses on years after those used to develop the 2015 VBT, which used data from 2002-2009, and it provides mortality information from the first half of the last decade. The experience is on fully underwritten life insurance sold individually. It excludes group life, converted, substandard,
guaranteed and simplified issue business.
Figure 2 - Ratio of Mortality Rate to SOA 7580
The number of companies contributing to the study vary by calendar year. The least number of companies comes from 2009 where 48 companies contributed, while the most is from 2014
when 93 companies contributed.
TERM
Attained Ages 0-69
As young-to-middle ages had the most historical mortality improvement when moving from older industry tables to newer tables, let’s first look at experience within attained ages 0-69 for term business. Many companies contributed data that was included in the ILEC study and a variety of selection criteria can be applied.
We chose to focus on plans that had preferred class(es) available, attained ages 0-69, policies issued 1996+, durations 4+, face amounts $100-249K and excluded post-level term experience.
Preferred underwriting (UW) criteria became more standardized after 1995 for companies that offered preferred. Claims rates from and patterns in durations 1-3 vary from the combination of the contestable period and company claims practices.1
This Term experience has more than 5,000 claims in each combination of Underwriting Class / Study Year group. The actual to expected (A/E) ratios by count using the 2015 VBT rates as the
expected basis are summarized in Figure 3.
Figure 3 - Attained Ages 0-69
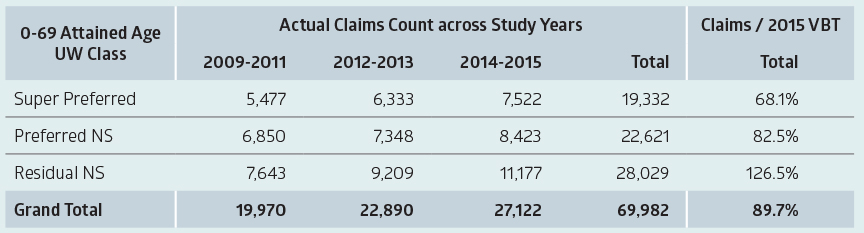
Note: Super Preferred represents the best of either three or four available underwriting classes. Preferred NS is mostly the 2nd best of three or four available and sometimes the best of two.
Observations from an analysis of the experience includes:
- Underwriting class provided a large differentiation in mortality rates. Super Preferred had 44% lower rates when compared to Residual. Preferred rates were 34% lower than Residual (Figure 4).
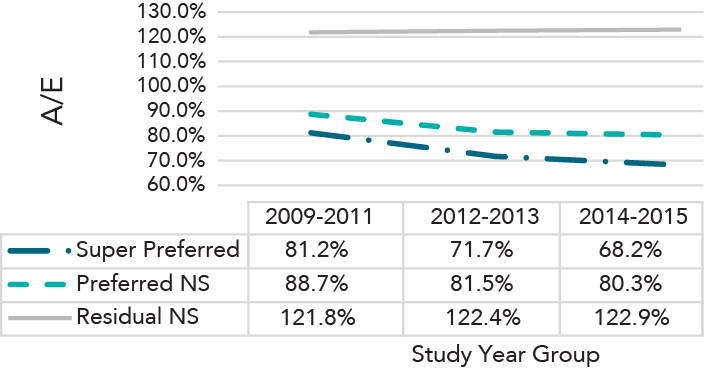
- Over time, the 2015 VBT A/Es generally decrease with the highest ratios in observation years 2009-2011 and the lowest from 2014-2015 in the Super Preferred and Preferred Nonsmokers underwriting classes.
- There is very little change in A/Es for Residual Non-smokers from 2012-2013 to 2014-2015.
Figure 4 - 2015 VBT A/E at Attained Ages 0-69 by Study Year and Underwriting Class
These observations indicate Term life-insured mortality generally continued to decrease across the first part of the past decade. The next summary (Figure 5) shows the 2015 VBT Count A/Es by Issue Year group for each underwriting class. Super Preferred and the Preferred Non-smoker classes display quite similar A/Es for each issue year group. Thus, the mortality rate decreases shown above are not explained by mix changes within issue year cohorts.
Figure 5 - 2015 VBT A/E at Attained Ages 0-69 by Issue Year and Underwriting Class
/SENECAL-Mortality-Figure5.png)
There are unanswered questions as to why the Residual Nonsmoker class does not have the same decrease in A/Es in later study years. Also unanswered is why this class has decreasing
A/Es in more recent issue years.
It is difficult to answer some of these questions from an industry study which combines many companies with different mixes of business that cannot be differentiated. Some insureds in this
class could have found lower rates and obtained new policies.
The marketing of the newer Standard Plus underwriting class could have facilitated this, increasing the exodus rate of better risks from the Residual group. It is also possible that the Residual group was more affected, some years after policy issue, by negative health-related changes that are impacting the U.S. population, such as cardiovascular disease.
SCOR’s attained ages 0-69 mortality experience through 2017 has also been analyzed using an internally developed mortality table that has an additional underwriting class dimension.
Much of the recent study year experience exhibited 8%-12% lower mortality rates when compared to study years 2010-2013. Paralleling the ILEC results, there was generally more
improvement in Super Preferred and Preferred Non-smoker classes than in the Residual Non-smoker class.
Let’s review our tour of attained ages 0-69 Term mortality.
- These ages cover most of the individual life term exposures.
- Historical life-insured mortality improvement seen in the industry tables has been high. There is no smoker distinction in the SOA 7580 mortality table. The 2001 VBT reflected very little experience on policies with the issue years 1996+ general style of preferred underwriting. Much of the experience underlying the 2015 VBT was from issue years 1996+.
- Preferred and Super Preferred, throughout most of the last decade, continued to produce much lower mortality than Residual. Each class’s preferred discount remained stable or mildly improved.
- Recent life-insured mortality, compared to 2015 VBT, displayed some improvement.
- Relatively stable life underwriting and distribution since 1996 may lead to revised life-insured mortality improvement expectations for this decade. Life-insured mortality improvement could be more moderate compared to the higher rates seen across previous industry tables. As accelerated underwriting processes open the door to more people who might not otherwise go through the underwriting process to obtain insurance, it is reasonable to expect future differences in mortality level and slope by duration, as well as differences in future improvement.
PERM
Experience on Permanent Products, Attained Ages 0-69
Adoption of three or more Non-smoker UW classes was slower for Perm products. The next summary shows there were relatively few Perm Super Preferred claims in the ILEC study, with very few from issue years before 2005. This different historical Perm UW class distribution drove higher Perm 2015 VBT A/Es overall. However, within each UW Class, the Perm mortality rates in Figure 6 are a lot like the Term (Figure 3) mortality rates.
Figure 6 - Experience on Permanent Products, Attained Ages 0-69
Perm experience had about one-third of the Term claims and as a result the credibility within a study year group is lower, especially for Super Preferred. Due to the lower credibility, less emphasis could be placed on any observed differences in the timing of mortality rate changes and instead focus on overall observed changes. Figure 7 displays significant decreases in Super Preferred and Preferred Non-smoker mortality after 2011. Thus, the direction of change in mortality rates in the first half of the last decade for attained ages 0-69 with Perm life insurance coverage has been the same as it was for Term.
Figure 7 - 2015 VBT A/E at Attained Ages 0-69 by Study Year and Underwriting Class
Mortality within Attained Ages 70-84 and 85+
The characteristics of life insurance policies on insureds with attained ages 70+ can be described as complex and displaying convergence of mortality rates at very high attained ages. For instance,
- Term provided 75% of attained ages 0-69 ILEC experience and 40% of 70-84 experience. Conversely, almost all the ages 85+ exposure is from Perm.
- Use of specific “older age, 70+” underwriting tests increased across 2003-2008. With limited study years there is correlation of duration and issue year groups. It is unclear whether observed durational mortality differences, even as a percent of 2015 VBT, are driven by duration or by issue year underwriting and marketing.
- Differences in mortality rates between Preferred and Residual are less at ages 85+ than they are at ages 0-69. How much preferred discount wears off by attained age 70, 75 and 80? This is a topic that could warrant an article all by itself.
- As noted in Figure 8, a much larger portion of ages 85+ exposure is on Residual policies and very little is from Super Preferred. This is in part due to the slower adoption of preferred risk classes on permanent business, which drives the exposure at the oldest attained ages.
Figure 8 - Underwriting Class Exposure Percent of Attained Age Group
Estimation of life-insured mortality improvement for attained ages 70+ should be considered complex. Noting much less historical improvement for attained ages 85-89 and 90+ indicates only data known to be from very similar risks should be used to compare mortality rates across study year groups.
Given the changes in mix of business and underwriting approaches over time, it is difficult to tell if improvement is occurring or if changes in mortality rates are due to a cohort of business moving through particular durations. The inherent complexity highlights the benefits of studying attained ages 70+ observed mortality across underwriting class, attained age group, duration and other characteristics to better understand the drivers of the experience.
Conclusion
Attained ages 0-69 provide a very large proportion of U.S. Fully Underwritten Individual Life exposure amount. After 1980, the Smoker proportion decreased significantly. After 1990, new underwriting as preferred-or-better was introduced and became a majority by the early 2000s.
Thus, reductions in
life insured mortality rates exceeded population mortality improvements between
1980 and 2010. Relatively moderate life insured mortality rate
improvements, compared to 2015 VBT, are observed in the SOA’s ILEC experience
after 2011.
The complex and more limited older age mortality experience discourages improvement estimation. This is especially true for relatively short periods like 5-10 years. Thus, the low
historical ages 85+ improvements deserve consideration when estimating future improvements.
The life-insured survivorship curve is now even more “square” in shape. On permanent products with very low lapse rates, most death claims are expected in ages 85+. The related financial and pricing implications are significant. This is especially true for permanent products with low cash
value (high net amount at risk) where future expectations include low nominal interest rates.