SCOR as the researcher and in collaboration with the Society of Actuaries (SOA), recently released a predictive modeling study of post-level term (PLT) life insurance lapse and mortality, U.S. Post‐Level Term Lapse and Mortality Predictive Modeling.
As an extension to the traditional experience study analysis U.S. Post-Level Term Lapse and Mortality Experience, predictive models were built to provide unique insights into the understanding of the drivers of behavior in PLT. The study provides details on the predictive modeling techniques followed to model lapse and mortality related to post-level term. The report also includes discussion on the key findings alongside a detailed presentation of the model results. In addition to the report, Tableau dashboards have also been published. This provides insights into the predictive modeling results using interactive visualizations.
Shock Lapse
The shock lapse in the last duration of the level term period was modeled in a Generalized Linear Model (GLM) framework. The GLM approach allows for modeling the impact of multiple variables and their interactions.
The premium increase at the end of term has been identified in earlier studies as a key driver of the shock lapse behavior. In addition to this premium jump, the GLM also includes the variables attained age, face amount, risk class, term plan, billing type and premium mode demonstrating that these variables are significant predictors of shock lapse behavior.
The predictive modeling highlights that the inclusion of other variables in modeling shock lapse is more important when the premium increase is lower. In the lower premium jump range 1.01x‐3.00x, policyholder behavior is more sensitive to the premium increase but also to changes in these other variables. When premium jump is lower there is more variation in the behavior depending on policyholder characteristics such as attained age and premium characteristics in terms premium payment mode and billing type.
The predictive model captures these relationships, and review of the model outputs highlight the deeper insights into shock lapse behavior at the end of term. Figure 1 provides a screenshot of the interactive Tableau dashboards.
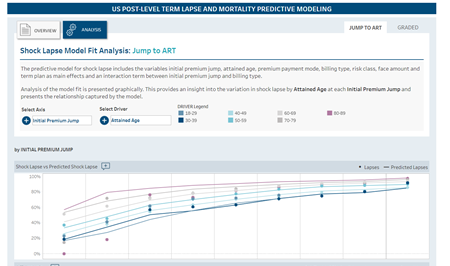 Figure 1 - Illustration of the Tableau dashboards
In the graph presented here, the dots represent the observed shock lapse in the last duration of the level term period while the full lines illustrate the model predicted shock lapse probability. Figure 1 shows the variation in shock lapse by attained age at each initial premium jump group and presents the relationship captured by the model. Reviewing the model output using the Tableau dashboards provides a visualization of the relationship between any two selected variables and the shock lapse at the end of term.
Mortality Deterioration in PLT
Directly modeling the relationship between shock lapse at the end of term and mortality deterioration in PLT was a key objective of predictive modeling. A correlation between shock lapse and mortality deterioration observed in the traditional analysis results was discussed in the May 2021 SCORviews article, as the factors that lead to higher shock lapse at the end of term also lead to higher mortality deterioration in PLT.
The relationship between shock lapse and mortality deterioration was investigated, before considering other variables by modeling mortality deterioration in PLT in a two-step approach. Firstly, a predictive model was built to define the relationship between shock lapse at the end of term and mortality deterioration in PLT through non‐parametric methods. Then, adjustments by other variables were applied using GLM techniques to build the final model for mortality deterioration including only the variables that were significant after allowing for variation explained by the shock lapse.
Modeling in this two‐step approach provides insight into the variation in PLT behavior that can be explained by the shock lapse relationship and highlights where other variables have an impact on PLT behavior. The shock lapse relationship model developed in the first step, captures the mortality deterioration in PLT as a function of the duration in PLT and the shock lapse probability. While the pattern of mortality deterioration in PLT is captured accurately at an overall level, in step two additional variables were required to build the final model to fully explain anti‐selective behavior.
For Jump to ART, mortality adjustments by initial premium jump, risk class, billing type and premium mode were applied in the final model. For each of these variables, the shock lapse did not predict the mortality deterioration pattern in PLT highlighting differences in anti-selective behavior. For example, the mortality deterioration pattern by risk class was not captured by the shock lapse relationship model and further adjustment was required in the final model as illustrated Figure 2.
Figure 2 - Actual Over Expected Number of Deaths for Jump to ART by Risk Class
Figure 2 shows A/E analysis where the expected basis (E) is the model output prediction, and it is compared to the actual experience (A). This analysis was carried out to assess the model fit for the step one model (shock lapse relationship model) and the step two model (final model). This provides insight into how well the mortality deterioration variation by risk class can be explained by including only the shock lapse variable (left panel) compared to a final model including additional variables (right panel).
Mortality deterioration was higher for Super Preferred and Preferred risk classes compared to Residual, irrespective of smoker status as illustrated by A/Es higher than 100% in the left panel of Figure 2. In fact, the 100% A/E line is outside the confidence interval for Super Preferred NS and Preferred NS risk classes highlighting that the difference in mortality deterioration by risk class was not explained by the shock lapse relationship.
The final model included the risk class variable with three categories (Residual, Preferred and Super Preferred) and captured adequately mortality deterioration variation showing that differences by smoking status were not significant. This is illustrated by the 100% line falling within the confidence interval for all risk classes in the right panel of Figure 2. This model fit comparison analysis can be reviewed for each variable using the Tableau dashboards.
Lapse in PLT
A similar two-step approach was applied to model the lapse rates by duration in PLT. Predictive modeling provides the capability to directly capture the PLT lapse patterns that can be explained by the shock lapse and identify the behavior in PLT that is driven by other variables.
Shock lapse, as an explanatory variable, models the lapse rates by duration in PLT accurately at an overall level, but additional variables were required to fully explain lapse behavior in PLT. For Jump to ART, adjustments by risk class, face amount, initial premium jump and premium mode were applied in the final model. The lapse rates in PLT differ by these variables even after allowing for the shock lapse relationship.
For example, there was an increasing pattern of lapses by face amount band that was not explained by the shock lapse variable. This is illustrated in Figure 3 which shows an A/E analysis to compare the model fit for the step one model (shock lapse relationship model) and the step two model (final model).
Figure 3 - Actual Over Expected Number of Lapses for Jump to ART by Face Amount
There continues to be an increasing relationship between face amount and lapse in PLT and, in fact, the variation appears to be wider for lapse in PLT than for shock lapse as including the shock lapse only does not capture the relationship sufficiently (left panel). After including face amount as a variable, the relationship between face amount and lapse in PLT is captured by the final model (right panel). This model fit comparison analysis can be reviewed for each variable using the Tableau dashboards.
Conclusion
The full report available on the SOA website provides more details on the predictive modeling techniques used to model lapse and mortality and the relationship between them. The discussion in this article is focused on the Jump to ART modeling, but details on predictive modeling for Graded PLT premium structures is also covered in the full report.
Predictive modeling provides a new way of studying PLT policyholder behavior. The model outputs capture the pattern of lapse and mortality in PLT and highlight which variables are key to explain behavior. Shock lapse, as an explanatory variable, models the mortality deterioration and lapse pattern by duration in PLT accurately at an overall level, but additional variables were required to fully explain the anti-selective behavior. These model output results can be reviewed using the interactive Tableau dashboards.
Please feel free to reach out to the report authors with any questions you may have regarding the findings.